Click here to go to the state-level financial report
Each school district and county office of education must submit its financial data to the California Department of Education (CDE) in a uniform format using the Standardized Account Code Structure (SACS). The data posted on Ed-Data are provided by the CDE and are the unaudited actuals. LEAs report their financial data to CDE based on the state fiscal year – July 1 through June 30.
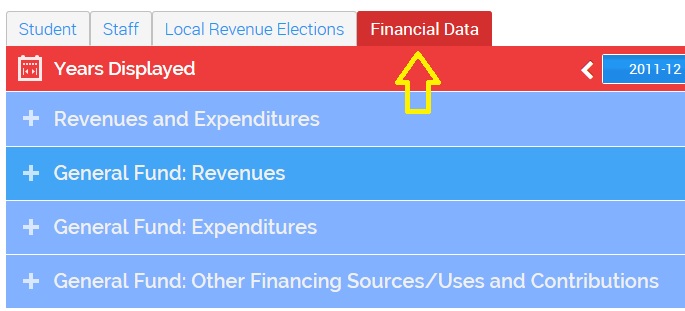
The Ed-Data financial reports are organized into four sections, which you can expand by clicking on the blue bars:
- Revenues and Expenditures, including summary information on Governmental Funds, including the General Fund, Proprietary Funds, and Fiduciary Funds.
- General Fund Revenues by specific program or revenue source.
- General Fund Expenditures, including expenditures by Activity, such as Instruction, Pupil Services, and General Administration; and by Instructional Program, such as regular K-12 Education, Special Education, and Vocational Education.
- General Fund: Other Financing Sources/Uses and Contributions, including Transfers, Proceeds from Leases, etc.
For county offices of education, the reports provide information on the County School Service Fund. The state-level report provides summaries of General Fund and County School Service Fund revenues and expenditures statewide.
|
Please Note:
|
Where to find the financial data
Financial data are available at the district and state levels. To get to the financial data for a school district, county office of education or at the statewide level, click on the "Financial Data" tab.
Tips for viewing the reports on Ed-Data:
We have streamlined the new reports to make it easier to see summary information, but you can access the details with a simple click:
- If the account codes are in blue, e.g.
, you can click on them to expand that category for details on the account codes that fall within that range.
- Click on the
icon for the California School Accounting Manual (CSAM) definition of a particular object, function, or resource code.
- Point your mouse at the
for more information on what is included within a particular category.
- Click the “Graphs” tab at the top of the table to view 5-year trend data where available.
- The “Years Displayed” bar at the top of the reports allows you to easily move among years of data.

Note: If you change the report year, you will remain on that year for all the financial reports until you change it again. - Click the
icon to download the data into Excel. (Note: The download will include all the data visible in that table. If you expand the report to show additional account code categories, those will be included in the Excel sheet. If those categories are collapsed, they will not appear in the download.)
- Click the
icon to generate a link to a specific table that you can email or paste on a website.
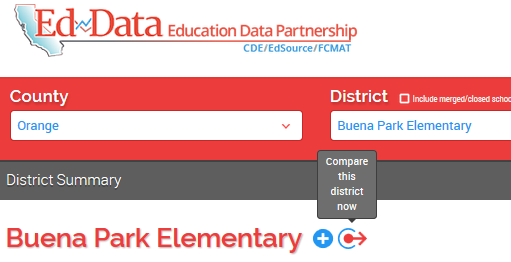
How to compare financial data
You can compare district finances, or view data for multiple districts in one place by clicking the icon to get to district comparisons. You'll find it right by the district name:
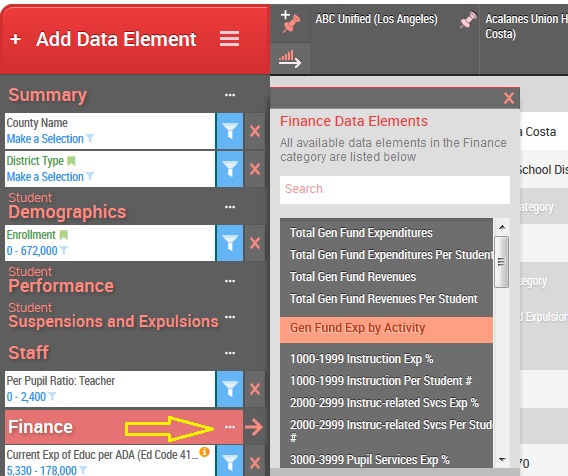
You can also get to District Comparisons from the "Comparisons" menu at the upper right corner of each page. Once there, scroll down and click the ... next to "Finance" to view all available finance data elements.
More about the data in the financial reports:
School District Reports
Districts report their revenues and expenditures to the California Department of Education (CDE) prior to the completion of their annual audit. Every effort is made by the CDE to catch errors or misinterpretations. However, the unaudited information is not changed after it has been certified and released by CDE. Therefore, the SACS financial reports may include data that districts later correct, based on their audits.
The financial reports on Ed-Data take advantage of the SACS format to present financial information in different ways. These include All Funds, General Fund revenues and expenditures, General Fund expenditures by activity, General Fund expenditures by instructional program, and Revenue Sources.
County Office Reports
County offices of education offer instructional programs, particularly Special Education, Vocational Education, instruction in juvenile detention facilities, and programs for students at risk of failing. The County School Service Fund is analogous to districts’ General Fund. Ed-Data presents data for All Funds and County School Service revenues and expenditures, plus expenditures by activity and by instructional program, in the Financial Report for County Office.
The General Fund
The General Fund, the largest part of the budget, covers most of the district’s operations. The money is categorized as Restricted or Unrestricted depending on the funding source. For example, many federal and state categorical programs are designated as Restricted because of regulations about how the money may be spent. Unrestricted revenues can be spent at the discretion of the school board—but within the constraints of contracts with employees and the Education Code.
Per-Pupil Revenue Figures
Ed-Data per-pupil revenue figures are based on General Fund revenues only, because such figures are the most appropriate to use for comparing the funds available to districts regardless of their size or configuration. Additional revenue information for individual districts (from governmental, fiduciary, and proprietary funds) is available in the Revenues and Expenditures report. However, Ed-Data does not provide a per-pupil calculation for revenues outside the General Fund because they vary based on unique district circumstances. Given such variations, comparisons on a per-pupil basis would be meaningless at best and could be extremely misleading.
Counting Students: ADA and Enrollment
California's method of counting students is average daily attendance (ADA), which is the total days of student attendance divided by the number of instructional days in the school year.
Reported to the CDE three times a year, ADA figures are referred to as First Principal Apportionment (P1), Second Principal Apportionment (P2), and Annual Apportionment, the final one in the summer. ADA is used for a variety of funding purposes, with adjustments spelled out in the Education Code.
ADA differs from enrollment. Enrollment data on Ed-Data come from the California Student Longitudinal Data System (CALPADS) and is a count of students enrolled at each school on a specific day in October. ADA is normally less (approximately 95%) than actual enrollment because absences, even if excused, are not included in ADA. Note: While enrollment counts include all charter schools authorized within the district, the ADA only includes charter schools whose financial data are reported in the school district's General Fund, without regard to whether the charter school is locally or direct funded.
The ADA used for per-pupil calculations on the General Fund tables is the same that the CDE uses to calculate the Current Expense of Education. Although the Financial statement shows a per-ADA amount for revenues, a different basis, such as enrollment, can determine the revenue received by districts and county offices of education for certain restricted programs. For example, some programs may generate funding depending on the specific needs of the student population. Similarly, the Financial statement shows expenditures per ADA, but that may not accurately reflect the actual amount spent for each pupil because not all pupils in a school or district participate in the same programs or receive the same level of services.
Why expenditure numbers don't always agree
The "Current Expense of Education" is total General Fund expenditures minus food services, facilities acquisition and construction, and certain other items. That number is divided by ADA to get the per-pupil amount shown in the Current Expense of Education per ADA table in the General Fund Expenditures statement. CDE performs the calculations according to an Education Code formula. A statewide file of Current Expense data is available at www.cde.ca.gov/ds/fd/ec.
The per-student figures on Ed-Data can differ from the numbers a school district publishes or refers to in discussions, depending on which items are included. In comparing figures, also be sure that the fiscal years are the same.
School districts or county offices sometimes use a per-pupil number that is based on the total General Fund expenditures and Second Principal Apportionment (P2) ADA rather than the specific definitions and annual ADA used for Current Expense of Education.
District context makes comparisons more meaningful
Districts vary widely in size, characteristics, philosophies, and challenges. Their expenditures differ, often for good reasons. The "per-pupil" number gives meaning and permits comparisons. The "percent of average" is provided as a frame of reference. It is important to investigate what is behind these numbers.
Districts have different averages for several reasons, including:
- Definition of a category. The title of a category may imply a single subject, but often it has several components. For example, according to the Accounting Manual, the "Superintendent" category may include full-time, part-time, and prorated portions of salaries of deputy, associate, area, and assistant superintendents as well as the superintendent. The more people slotted into a category, the higher the average expense.
- Deployment of personnel. One district may employ several part-time administrators, another may elect to hire more student counselors, a third may choose to emphasize primary grade reading coaches. Districts may even have low averages due to unfilled positions. Each district makes its own decision about which personnel to hire in each employee category. Differences from statewide averages are the rule, not the exception, but generally reflect these decisions.
- District size. Two districts could spend the same on superintendents, but the larger one will have a lower per-pupil number. This so-called "economy of scale" is a fact, not a choice of the district.
- Seniority of employees. A more experienced faculty will be paid more than a group of novice teachers, and the same is true for superintendents, administrators, and classified employees.
- The full package of salaries and benefits: one district may negotiate higher salaries and lower benefits; another may agree on lower salaries and higher benefits; a third may elect to have higher salaries and benefits but make the necessary fiscal trade-off by enlarging class size (i.e., fewer teachers earning more with more students in each class).
Taking financial data out of context can be misleading. Every school district's financial statement is public but may need explanation from the district office.
Note: Districts report their revenues and expenditures to the California Department of Education (CDE) prior to the completion of their annual audit. Every effort is made by the CDE to catch errors or misinterpretations. However, the unaudited information is not changed after it has been certified and released by the CDE. Therefore, the financial reports on Ed-Data may include some uncorrected data.